Tenant Configuration
Tailor your tensai experience by customizing data points and consuming relevant information in your Operational Insights dashboards. Fine-tune selections through a series of choices.
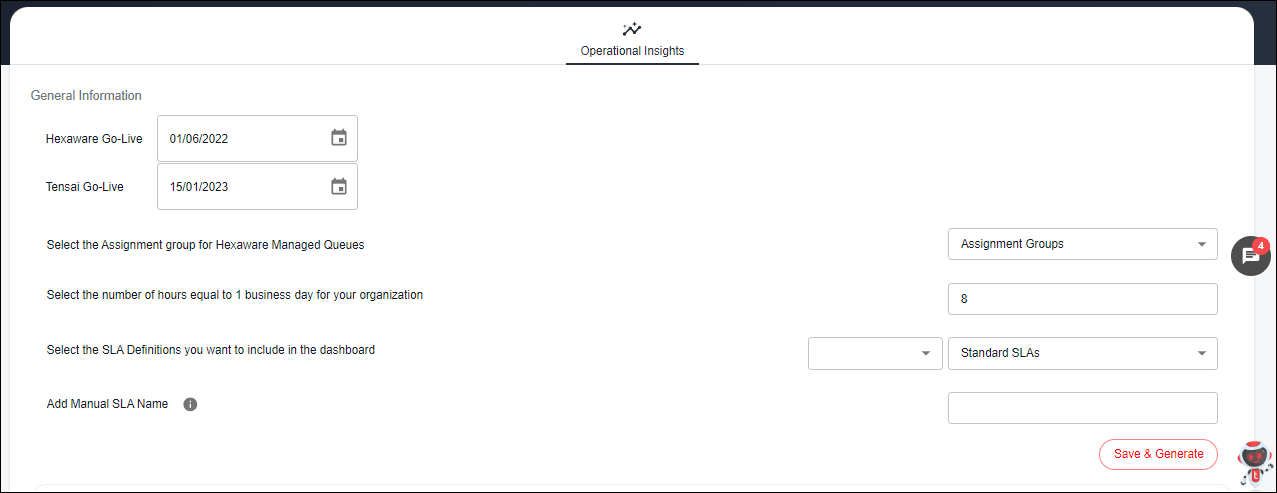
General Information
Fields Overview
Hexaware Go-Live
- Hexaware's ITSM implementation Go-Live date for the client is required to pull in data from the ITSM tool.
Tensai Go-Live
- Tensai implementation Go-Live date for the client.
Select the Assignment group for Hexaware Managed Queues
- Based on the Assignment groups data is filtered in the dashboards.
Select the number of hours equal to 1 business day for your organization
- Hours to Business Day conversion is done for the SLA Definitions tracked from the ITSM tool.
Select the SLA Definitions you want to include in the dashboard
- Select the SLA categories from ITSM, Infra Monitoring, and Contact Center.
- You can then select specific SLAs from a list of standard SLAs for your organization.
Add Manual SLA Name
- If your SLAs are not a part of the standard set of SLAs, you can add the same as a Manual SLA.
- You can add multiple Manual SLAs in a comma-separated manner.
Save & Generate
- Click this to save all the above information and populate the SLA table below.
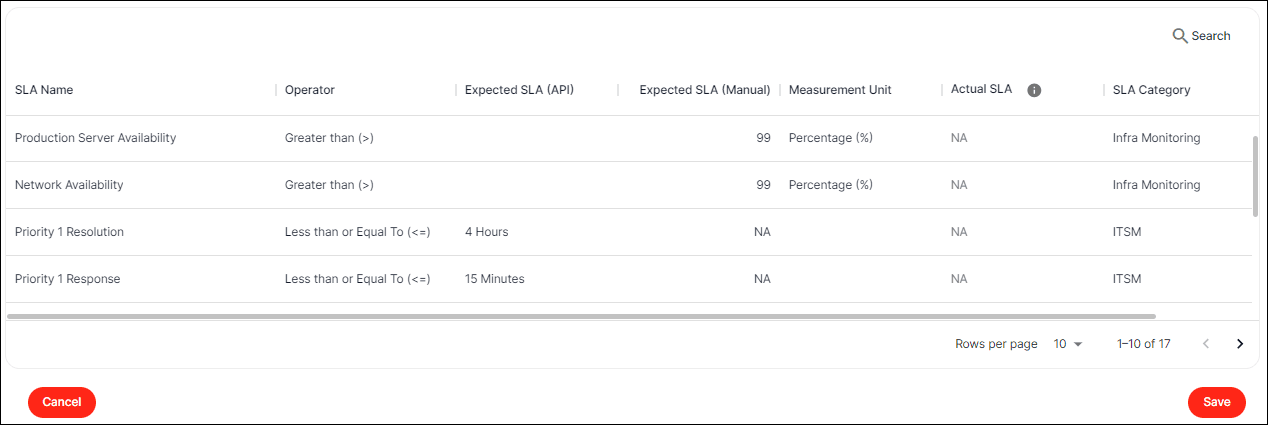
SLA Table
Fields Overview
SLA Name
- The SLAs selected above will be shown in this column.
Operator
You can select a specific operator based on which the SLA actual value will be compared with the SLA expected value. It includes operators such as less than , greater than , etc.
Expected SLA (API)
- If the SLA is a standard ITSM SLA, the expected SLA will be populated from the respective SLA Definition API.
Expected SLA (Manual)
- If the SLA is manual, you can populate the Expected SLA manually.
- **Note:**If the SLA is a standard ITSM SLA, you can add Percentage thresholds here as needed. For example, Expected SLA is 95% of all incidents that meets in < = 2 hours.
Measurement Unit
- For the Expected SLA (Manual) value, you also need to select the respective Measurement Unit based on which the values will be compared with the actual SLA.
Actual SLA
- For a manual SLA, add the actual SLA values for the last six months in descending order of months, starting from the last month.
- Note: At the end of each month, a Tenant Admin needs to update the SLA value for the last month for all manual SLAs.
SLA Category
- Select the respective SLA Category to be tagged.
Save/ Cancel
- Save the data that has been filled in the table, so that the information can be populated in the Quarterly Compliance dashboard.
- Cancel to discard the latest changes.
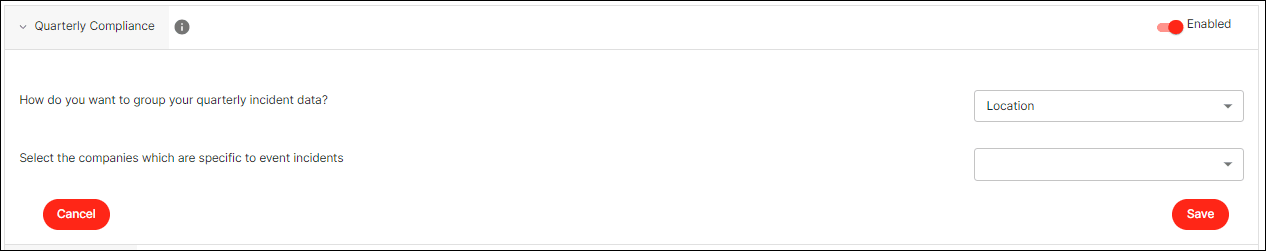
Quarterly Compliance
Fields Overview
How do you want to group your quarterly incident data?
- Allows you to group the incidents by location or company, as required.
Select the companies that are specific to event incidents
- You can select the assignment groups that trigger event incidents.
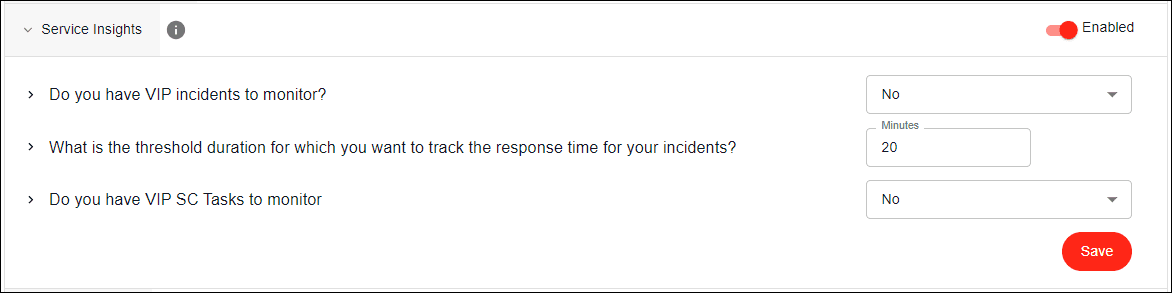
Service Insights
Fields Overview
Do you have VIP incidents to monitor?
- Confirm if you want to monitor any VIP Incidents.
What is the threshold duration for which you want to track the response time for your incidents?
- Track a specific response time threshold for incidents.
Do you have VIP SC Tasks to monitor?
- Confirm if you want to monitor any VIP SC Tasks.
AIOps Insights
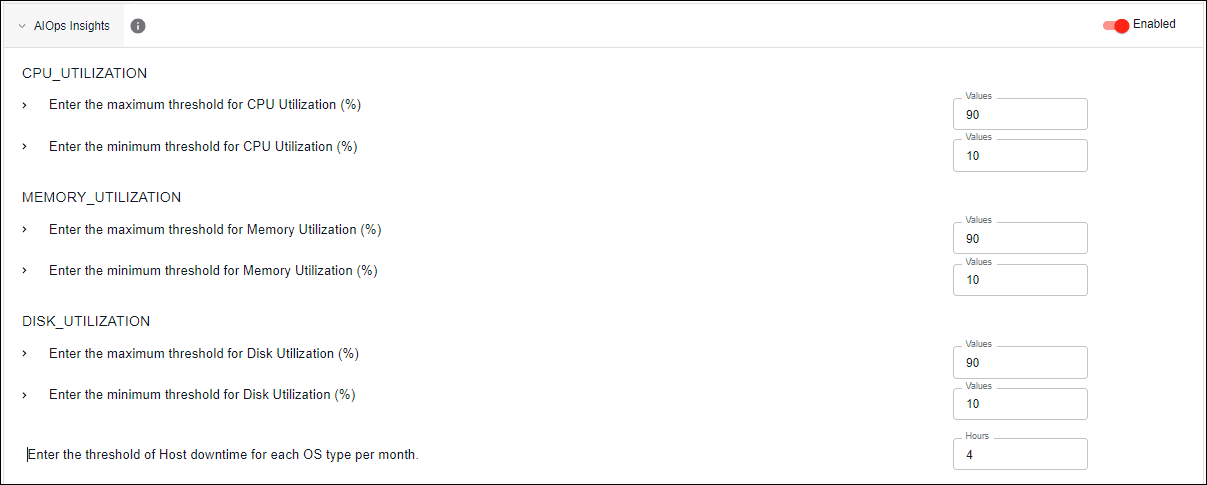
Fields Overview
Enter the maximum & minimum threshold for CPU Utilization (%)
- Monitor hosts with high and low CPU utilization %.
Enter the maximum & minimum threshold for Memory Utilization (%)
- Monitor hosts with high and low Memory utilization %.
Enter the maximum & minimum threshold for Disk Utilization (%)
- Monitor hosts with high and low Disk utilization %.
Enter the threshold of Host downtime for each OS type per month.
- Track hosts by OS Type which are down for more than the specific threshold each month.
Automation Scorecard
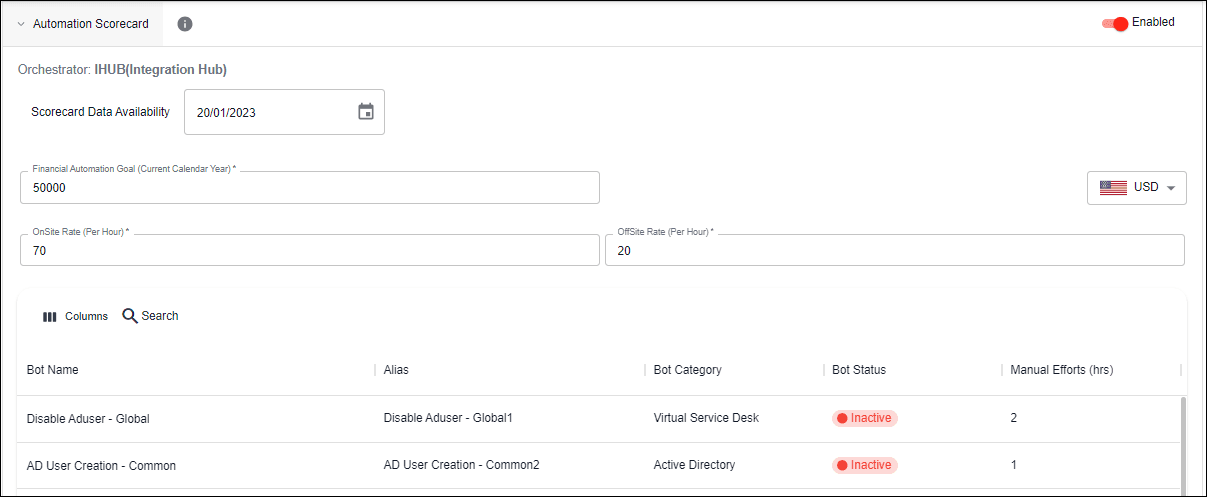
Fields Overview
Scorecard Data Availability
- Add the date from which data will be available to be tracked on the scorecard.
Financial Automation Goal (Current Calendar Year)
- Set the financial goal of the year that you want to achieve through automation based cost savings.
Onsite Rate (Per Hour)
- Set the onsite FTE rate to calculate cost savings from manual effort saved. Offsite Rate (Per Hour)
- Set the offsite FTE rate to calculate cost savings from manual effort saved.
Bot Alias Name
- Maintain separate Alias names for your configured bots for ease of understanding on the Automation Scorecard dashboard.
Bot Category
- Select the respective Bot Categories for all the configured Bots.
Bot Status
- Monitor the current status of the bots.
Manual Effort (hrs)
- Configure the actual manual effort required for performing the work currently being done by the specific bot.
Refresh
- Refresh the bots in the table to add any new bots configured recently from the Automation Fabric.
Connect Insights
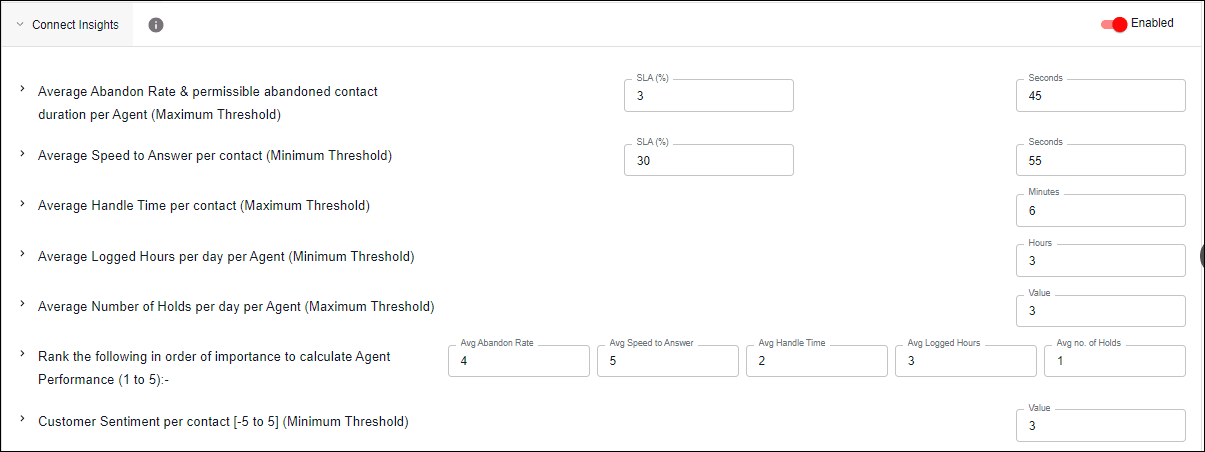
Fields Overview
Average Abandon Rate & permissible abandoned contact duration per Agent (Maximum Threshold)
- Threshold values needed for calculation.
Average Speed to Answer per contact (Minimum Threshold)
- Threshold values needed for calculation.
Average Handle Time per contact (Maximum Threshold)
- Threshold values needed for calculation.
Average Logged Hours per day per Agent (Minimum Threshold)
- Threshold values needed for calculation.
Average Number of Holds per day per Agent (Maximum Threshold)
- Threshold values needed for calculation.
Rank the following in order of importance to calculate Agent Performance (1 to 5)
- Rank the given values in order of importance to calculate the Agent Performance scorecard.
Customer Sentiment per contact [-5 to 5] (Minimum Threshold)
- Threshold values needed for calculation.
Average Agent Words per minute per contact (Minimum Threshold)
- Threshold values needed for calculation.
Average Customer Words per minute per contact (Minimum Threshold)
- Threshold values needed for calculation.
Select all the relevant Contact Flows
- Relevant Contact Flows to be select from the list of all Contact Flows.
Service Performance
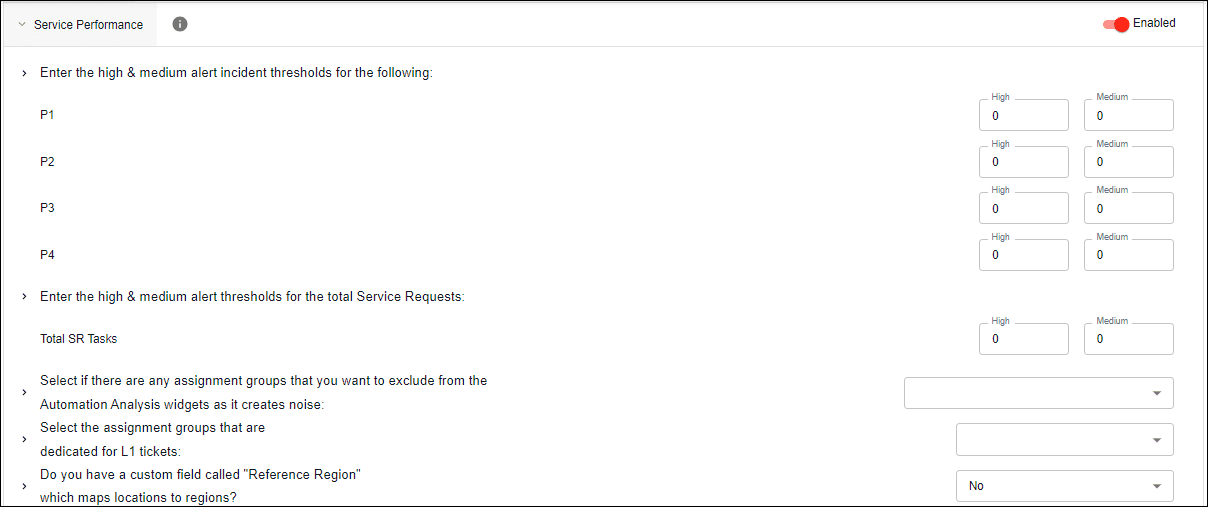
Fields Overview
Enter the high & medium alert incident thresholds for P1, P2, P3, P4
- Incident count will be shown in red when it breaches the high threshold, amber when it breaches the medium threshold, else it will remain in green.
Enter the high & medium alert thresholds for the total Service Requests
- Total Service Request count will be shown in red when it breaches the high threshold, amber when it breaches the medium threshold, else it will remain in green.
Select if there are any assignment groups that you want to exclude from the Automation Analysis widgets as it creates noise
- You can filter out incidents from specific assignment groups to eliminate unnecessary incidents from the Automation Analysis view.
Select the assignment groups that are dedicated for L1 tickets
- You can select specific assignment groups to monitor the data for your L1 tickets.
Do you have a custom field called "Reference Region" which maps locations to regions?
- If the custom field is present in your ITSM tool the Region filter will be added to the Location-based Analysis view.
- Utilize the flexibility of the Tenant Configuration feature to align the platform with your organization's unique needs and objectives.
- Ensure that you make informed decisions when enabling or disabling these features to align with your organization's needs.
- Regularly review the status of these features to ensure they align with your organization's evolving requirements.
- Collaborate with relevant stakeholders when configuring these features to optimize their use.